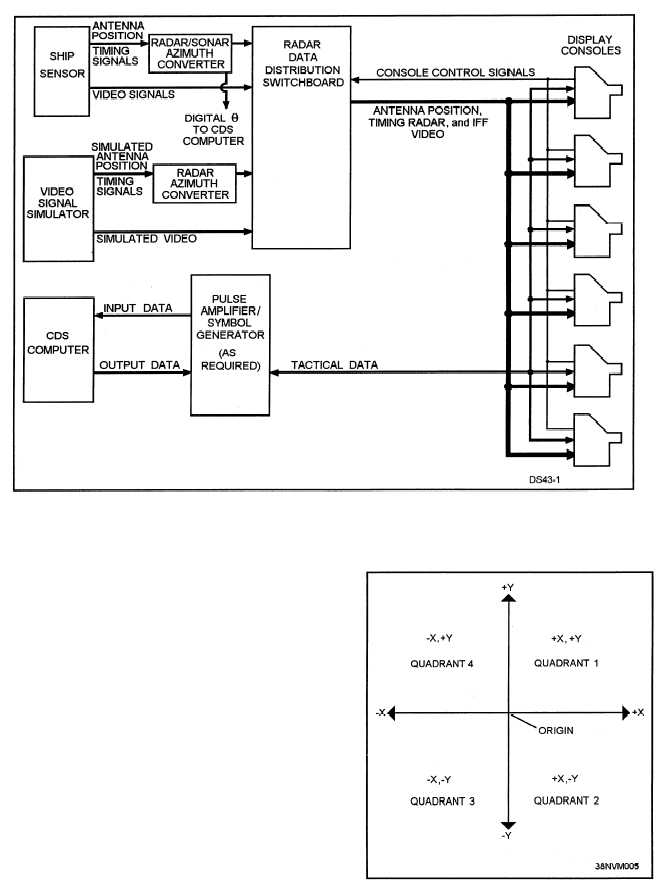
Figure 3-1.—The AN/UYA-4(V) data display system.
The DC and DU pulse trains are generally
developed by using the sine and cosine of the antenna
angle. The sine and cosine of the antenna angle will
define the angle in a 90-degree quadrant. The sign
bits (sign of DC, sign of DU) will determine in which
quadrant the sweep will repainted. The quadrants
and required sign bits are illustrated in figure 3-2.
The DC and DU pulse trains are sent to the display
console where they cause a pair of digital counters to
increment one time for each pulse. The number of
pulses between the zero mile range mark (start of
sweep) and the end of sweep signal denotes the radar
sweep angle, and the spaces between pulses indicate
the range of the sweep. For example, the sine and
cosine of 45 degrees are equal to each other. To paint
a sweep at 45 degrees, the sign of DC and the sign of
DU will both be positive indicating quadrant one. In
developing the DC and DU pulse trains, the number of
pulses for each would be equal. This will increment
3-3
Figure 3-2.—The X/Y quadrants
of a CRT.